E-ISSN:2349-3275
P-ISSN:2349-5502

Research Article

Allelic frequency

Biomedical Review-Journal of Basic and Applied Medical Science

2016 Volume 3 Number 2
Publisherwww.medresearch.in

Frequency distribution of blood group with its allelic configuration among the studied population of Delhi NCR region

Basak A.1*, Manveen K.2

1* Asim Kumar Basak, Professor & Head, Department of Physiology, Sudha Rustagi College of Dental Sciences & Research, Faridabad, Haryana, India.

2 Kaur Manveen, Assistant Professor, Department of Physiology, Sudha Rustagi College of Dental Sciences & Research, Faridabad, Haryana, India.

Introduction: Since the discovery of ABO blood group system by Landsteiner in 1900 and Landsteiner & Wiener in 1940, a voluminous data is available on the frequencies of ABO blood group and also Rh factor for most parts of the world which varies depending on geographical belt including India. In this relation there is no report of occurrence of blood group and Rh factor of the population residing in Delhi-NCR region including Faridabad district. So the present study is undertaken to find out the normal ABO and Rh frequencies among the localites of Delhi-NCR belt along with their allelic frequency and to compare our result with other studies conducted in different parts of India. Methods: A total of 1178 domicile individuals from Delhi NCR are selected from the BDS students, staffs of the Dental colleges for blood group determination. The ABO and Rh factor are determined immediately after blood collection using the Tile or Slide testing. Allelic frequencies were calculated under the standard assumption of Hardy Weinberg equilibrium. The study was approved by Institutional ethical committee. Results: It is found that the most common type of blood group is B type followed by O, A and then AB. It is also demonstrated that the observed population of each ABO blood group is in accordance with the expected population as per Hardy-Weinberg’s equilibrium. Conclusion: The present study shows that the frequency distribution both ABO and Rh blood group among the studied population of Delhi NCR region is in accordance with the north Indian population including Haryana and Delhi and also is in accordance with the expected population as per Hardy-Weinberg’s equilibrium

Keywords: Allelic frequency, Blood group in Delhi-NCR, Mismatching of blood, Prevalence of blood group

Corresponding Author How to Cite this Article To Browse
Asim Kumar Basak, Professor & Head, Department of Physiology, Sudha Rustagi College of Dental Sciences & Research, Faridabad, Haryana, India.
Email:
Asim Kumar Basak, Kaur Manveen, Frequency distribution of blood group with its allelic configuration among the studied population of Delhi NCR region. Biomed Rev J Basic Appl Med Sci. 2016;3(2):168-172.
Available From
https://www.biomedicalreview.in/frequency-distribution-blood-group-allelic-configuration-among-studied-population-research-article

Manuscript Received Review Round 1 Review Round 2 Review Round 3 Accepted
2016-08-02 2016-08-04 2016-08-11 2016-08-18 2016-08-25
Conflict of Interest Funding Ethical Approval Plagiarism X-checker Note
Nil Nil Yes 17%

© 2016by Asim Kumar Basak, Kaur Manveenand Published by Siddharth Health Research and Social Welfare Society. This is an Open Access article licensed under a Creative Commons Attribution 4.0 International License https://creativecommons.org/licenses/by/4.0/ unported [CC BY 4.0].

Introduction

Since the discovery of ABO blood group by Landsteiner in 1900 [1] and Rh system by Landsteiner and Wiener in 1940 [2] it has been found that all human populations share the same blood group system i.e. Blood group A or B or O or AB and Rh + or Rh -, though the frequency distribution of specific types of blood group differs in different parts of the world and in different races. The frequency of blood group O is the most common whereas the frequency of A blood group is 2nd largest among Americans [3], Western Europeans [4], Central and South Americans, Australians and Central and Eastern Europeans [5]. On the other hand the frequency of B type of blood group is 2nd largest in Asian countries like China [6], India [7, 8, 9], Pakistan [10, 11, 12], Singapore [6] etc.

Similarly the prevalence of different blood group in different parts of India also varies. The frequency of blood group B is highest among the Bhramins and Rajputs of Himachal Pradesh followed by O, A and then AB [7], whereas in South India O group was found to be most common followed by B, A, AB [8]. In thisrelation there are few reports of frequency of blood group and Rh factor of the population residing in DelhiNCR region including Faridabad district.  So the present study is undertaken to find out the normal ABO and Rh frequencies among the localities of Delhi-NCR belt and to compare our result with other studies conducted in different parts of India which may help in-

1. The management of blood bank and transfusion services in this area.

2. Establishing possible associations of various diseases like cardiovascular disorders, cancers, peptic ulcers etc. to blood group in the said population living there.

3. In anthropological study of racial classification of said population and also in solution of problems of identity, percentage and etc.

Materials and Methods

A total of 1178 domicile individuals of both sexes are selected from the BDS students of SRDC, Faridabad and domicile patients reporting to Shanti Devi Memorial Hospital for blood group determination from Delhi NCR belt including

Faridabad district. The study is approved by the Institutional Ethical Committee.

Blood sample were collected under aseptic condition by venipuncture from the antecubital vein. The ABO and Rh factor are determined immediately after blood collection using the Tile or Slide testing method [13] using commercially prepared antisera-A, antisera-B and antisera-D (Span Diagnostics Ltd. Surat, India). The blood groups were determined on the basis of agglutination (under light microscope as and when required). As per the standard protocol the result was expressed as percentage which is considered as frequency distribution of each ABO blood group and Rh factor. The significance of difference between the observed frequency and the expected (Reference frequency) is done by Chi Square test [14]. Allelic frequencies were calculated by the help of Biological Esteem Excel Simulator developed by Jungek JR [15] under the standard assumption of Hardy Weinberg equilibrium with Ceppilini correction [16] assuming –

  • The ABO system is determined by three alleles of a single gene A, B and O in which A and B are codominant and both are dominant over O. This gene is in accordance to Hardy-Weinberg frequencies in the population.
  • The data were a random sample from the population.
  • Static allele frequencies in a population across generations assume: No mutation (the alleles don’t change), no migration or emigration (no exchange of alleles between populations), infinite population size and no selective pressure for or against any genotypes.

Results

The frequency pattern of ABO and Rh blood group of male and female among studied population is shown in Table-I. It is found that amongst the studied population the B blood group is most common in both sexes followed by Group O, Group A and then Group AB. Statistical analysis by Chi Square test reflects that the observed frequency distribution does fit to the expected i.e. reference frequency distribution or in otherwise there is no significant difference between the observed frequency distribution and reference frequency distribution (Fig 1). Moreover it is  lso demonstrated (Table 3) that the observed population of each ABO blood group is in accordance


with the  expected population as per Hardy Weinberg’s equilibrium. It is also found that the frequency distribution of Rh positive individuals is comparatively more in both male and female population than the Rh negative individuals and the Rh negative population in Delhi NCR is significantly lower than that of other countries but matches with that of reference distribution of other Indian provinces along with the north Indian population including Haryana and Delhi (Fig 1).

Table-1: Sex wise frequency distribution of ABO & Rh blood group in Delhi NCR.

Blood Group Male (N=412) Female (N=766) Total (N= 1178)
  AbsoluteValue Frequencydistribution (%) AbsoluteValue Frequencydistribution (%) AbsoluteValue Frequencydistribution (%)
A 100 24.3 180 23.5 280 23.8
B 144 34.9 254 33.1 398 33.8
AB 55 13.3 111 14.5 166 14.0
O 134 32.5 200 26.1 334 28.4
Rh + 387 93.9 721 94.1 1108 94
Rh- 25 6.1 45 5.9 70 6

Capture.JPG
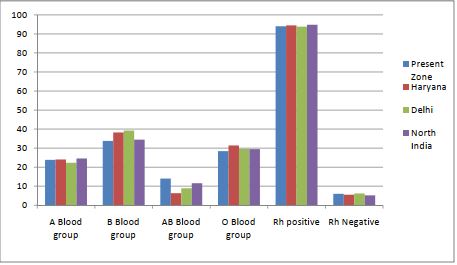
Fig-1: Graphical presentation showing frequency distribution of ABO & Rh blood group in present study, Haryana [21, 24], Delhi [25] and North India [16]

Table-2: Blood group and its genotypic & phenotypic frequency in the studied population of Delhi NCR.

Blood Group Allelic Frequency Genotypic Frequency Phenotypic Frequency
A p=0.1895 AA=0.0359 AO=0.2018 AA+AO =0.2377
B q=0.2558 BB = 0.0654 BO = 0.2724 BB+BO =0.3378
AB NA* AB =0.0969   AB = 0.0969
O r= 0.5325 OO =0.2835   OO = 0.2835
Rh + v= 0.7529 DD =0.5668 Dd=0.1860 DD + Dd =0.7548
Rh- u= 0.2471 dd = 0.610   dd = 0.0610

*NA = Not applicable

Table-3: Chi sq goodness of fit in between observed ABO population and Expected population as per Hardy –
Wienberg Equilibrium.

Blood group Observed population Expected population as perHW (Obs- Exp)^2/Exp
A 280 291.4 0.45
B 398 413.84 0.61
AB 166 116.76 20.76
O 334 356 1.36

Chi Sq value= 23.17, df = Phenotypes –Allele = 4-3=1, P<0.05

The allelic frequency of a blood group (p), B blood group (q) and O blood group (r) in the present study was found as 0.1895, 0.2558, and 0.5325 respectively as shown in Table-2 whereas the allelic frequency of Rh positive (v) and Rh negative (u) is respectively 0.7529 and 0.2471 respectively. The genotypic frequency of the studied population (Table 2) is also in accordance with other results in this region.

Discussion

Once Karl Landsteiner first described the ABO blood group in 1900[1], it started the new beginning of blood banking and transfusion medicine. It has been reported that the ABO blood group distribution varies in different geographical and ethnic groups, and socioeconomic groups [17]. In India, the ABO blood groups frequencies are variable, the frequency for B ranges from 6% in negritos of Andamans to 48% in Birijas of Bihar, while group A has a frequency of 20-30% in Western and Eastern Himalayas [18]. The blood groups frequencies in North India are B >O>A>AB [19]. The literature on the blood genetic markers among the population of Delhi NCR which includes Delhi and some of its neighboring areas like Faridabad, Gurgaon, Jhajjar, Palwal, Ghaziabad, Noida is however inadequate.

The present study shows that the frequency distribution both ABO and Rh blood group among the studied population of Delhi NCR region is in accordance with the north Indian population including Haryana and Delhi. This finding is in accordance with the similar study reported by different researchers [20, 21]. The present study is also in consistent with those observed by Bharadwaj and his group in 2004 [22] and also Mehta et al., 2011[23].


A gene for the specification of antigens A or B or type O determines the blood type. There are DNA differences, or polymorphisms, that determine the function of glycosyl transferase, resulting in different ABO blood types. So to elucidate the genetic frequency of ABO genes and D genes the allelic and genotypic frequencies are determined. The findings of the present study related to allelic and genotypic frequency consolidate our observation related to phenotypic and observed frequency distribution of both ABO and Rh blood group. The present findings related to the allelic and genotypic frequencies are also in agreement with the previous study among the population of Haryana [21, 24], Delhi [25] and even North India [16].

However there is some difference of Rh antigen genetic frequency. This may be due to the fact that in case of the Rhesus group, gene frequency has been determined only for D and d antigen, but not for other Rh group antigens (C, c, E, e). This is most likely the reason why Rh group distribution differs significantly from that expected under Hardy Weinberg equilibrium. It is therefore suggested that further study be undertaken to determine gene frequency of other Rh group antigens.

Acknowledgement: The assistance rendered by the management, administration and technical staff of the dept. of Physiology of the Institute is sincerely acknowledged for successful completion of this study.

Reference

1. Landsteiner K. Zur Kenntnis der antifermentativen, lytschen and agglutinierenden Wirkungen des Blutserums und der Lymphe. Zentralblatt Bakreriologie. 1900;27, 357-362.

2. Landsteiner K, Weiner AS,An agglutinable factor in human blood recognized by immune sera for rhesus blood. Proc.Soc.Exp.Biol.Med., .,1940;43,223-244.

3. Garraty G. Glynn SA. McEntire R. ABO and Rh (D) phenotype frequencies of different racial/ethnic groups in the United States. Transfusion. 2004;44,703-706.

4. Blood Bank.com, racial & Ethnic Distribution of ABO blood types cited 15th March.2005.

5. Reid ME, Lomas –Francis

C. The blood group antigen facts. 2nd Edition. 2004. New York; Elsevier Academic Press.

6. Chan KT, 1962, The ABO blood group frequency distribution of Singapore based on a blood donor sample. Sin. Med. J. , 3, 3-15.

7. Das PK, Nair SC, Harris VK, Rose D, Mammen JJ, Bose YN, Sudarsanam A. Distribution of ABO and Rh-D blood groups among blood donors in a tertiary care centre in South India. Trop Doct. 2001 Jan; 31(1):47-8.

8. Mukherjee R, Khatriya GK., 2004, Distribution of blood groups among Brahmins and Rajputs in Himachal Pradesh. Anthropologist., 6(4),293-294.

9. Basak A K & Maji K, Blood group and anemia: Exploring a new relationship. J. Pub. Health & Epi. 2013; 5(1), 43-45,

10. Khaskheli DK, Qureshi AH, Akhund AA, Distribution of ABO and Rh groups in the residents of Sindh. Pak J Health. 1994;31,45-50.

11. Hussain A, Sheikh SA, Haider M, Rasheed T, Malik MR. Frequency of ABO and Rh blood groups in population of Balouchistan (Pakistan). Pak Armed Forces Med. J.2001; 51,22-26.

12. Khattak ID, Khan TM, Khan P, Ali-Shah SM, Khattack ST, Ali A. Frequency of ABO and Rhesusblood groups in district SWAT, Pakistan. J Ayb Med Coll Abbottabad. 2008;20 (4),127-129.

13. Egesie UG, Egesie OJ, Usar I and Johnbull TO. Distribution of ABO, Rhesus blood groups and Hb electrophoresis among the undergraduate students of Nigar delta University, Nigeria, Nijerian J. of Physiological Sciences. 2008; 23(1-2), 5-8.

14. Mahajon B K: Chapter 11, In: Methods in Biostatistics, 6th ed., Japeee Brothers Med. Pub(P) Ltd. Pub, New Delhi, 2006.

15. http: // bioquest. org/ esteem/ esteem_details. php? product _id=209#

16. Agrawal A, Tiwari AK, Mehta N, Bhattacharya P, Wankhede R, Tulsiani S, and Kamath S. Asian J. Transfus Sci.2014; 8(2): 121–125.

17. Sidhu.S and Sidhu LS. ABO blood group frequencies among the Sansis of Punjab. Coll. Anthropol.1980; 4: 55-58.

18. Ahuja.S and Sidhu LS. Distribution of ABO blood


groups and some physical traits among the Gujjars of Punjab. Ind.J. Phys. Anthrop. Hum.Genet.1981;7:93-96.

19. Sehgal IK, Chahal SMS, Bansal IJS. Genetic variation in five endogamous groups of Patialadistrict, Punjab. J. Ind. Anthrop. Soc. 1986;21: 63-72.

20. Saini M & Yadav AS. American International Journal of Research in Formal, Applied & Natural Sciences, 2014;6(1), 73-75.

21. Verma U, Singroha R, Malik P. A study to find correlation between dermatoglyphic patterns and abo blood groups, Int J Anat Res 2015;3(3):1293-1297.

22. Bharadwaj A et al., 2004, Pattern of fingerprints in different ABO blood groups. JIAFM,, 26(1):6-9.

23. Mehta AA, Mehta AA, Sonar V. Digital dermatoglyphics in ABO, Rh blood groups. J.I.A.F.M, 2011;33(4):349-351.

24. Yadav B , Raina A, Kumar A, Bansal SK, Dogr TD. Allelic and phenotypic diversity of abo and rhesus (d) blood groups in the medical and dental apprentices of a university of Haryana, India, Int.Res. J of Nat.& Appl Sci,2014;1(6),57-67.

25. Garg N, Singh DK, Tomar R, Singh B. Phenotype Prevalence of Blood Group Systems (ABO, Rh, Kell) in Voluntary, Healthy Donors-Experience of a Tertiary Care Hospital in Delhi, North India. J Blood Disord Transfus 2015;6: 297. 2-4.