E-ISSN:2349-3275
P-ISSN:2349-5502

Research Article

Diabetes

Biomedical Review-Journal of Basic and Applied Medical Science

2014 Volume 1 Number 2
Publisherwww.medresearch.in

Relationship between Serum Uric acid and BMI in Pre Diabetics and Type II Diabetics in Rural Population – A Pilot Study

Srikanth S.1*, Lavanya Y.2, Sushma K.3

1* Sajja Srikanth, Professor, Department of Physiology, Dr. PSIMS & RF, Chinnavutapalli, Andhra Pradesh, India.

2 Y Lavanya, Assistant Professor, Department of Physiology, Dr. PSIMS & RF, Chinnavutapalli, Andhra Pradesh, India.

3 K Sushma, II M.B.B.S., Department of Physiology, Dr. PSIMS & RF, Chinnavutapalli, Andhra Pradesh, India.

Background & Objectives: People with pre-diabetes may have impaired fasting glucose (IFG) or impaired glucose tolerance (IGT). Some people may have both IFG and IGT. Uric acid can act as a prooxidant and may be a marker of oxidative stress, but it may also have a therapeutic role as an antioxidant. Hyperuricemia has been found to be associated with obesity and insulin resistance. Materials & Methods: The study was conducted in 100 male subjects in the age range 30-50 years. The questionnaire with questions on demographic data, seafood consumption, drinking and smoking information, personal and family history of diabetes and gout, previous history of hypertension, cardiovascular disease was taken. Height & Weight of the subjects was measured. BMI was then calculated. BP was recorded. Serum Uric acid was measured using Uricase-Trinder –Endpoint ; Erba Diagnostics ). For the diagnosis of pre diabetes the WHO (1999) criteria was used. In this study the enzymatic glucose oxidase - peroxidase (GOD – POD ; Erba Diagnostics) was used for estimation of blood glucose level. Results: From the present hospital based cross sectional study, we observed a significant increase in the serum uric acid levels in prediabetics when compared with the control & non diabetic subjects. Conclusion: Uric acid may perform the role of marker for deterioration of glucose metabolism. Pre-diabetics were at higher risk of developing uric acid related complications

Keywords: Atherosclerosis, Body Mass Index, Diabetes, Hyperuricemia, Insulin Resistance, Prediabetes

Corresponding Author How to Cite this Article To Browse
Sajja Srikanth, Professor, Department of Physiology, Dr. PSIMS & RF, Chinnavutapalli, Andhra Pradesh, India.
Email:
Sajja Srikanth, Y Lavanya, K Sushma, Relationship between Serum Uric acid and BMI in Pre Diabetics and Type II Diabetics in Rural Population – A Pilot Study. Biomed Rev J Basic Appl Med Sci. 2014;1(2):36-42.
Available From
https://www.biomedicalreview.in/relationship-between-serum-uric-acid-bmi-pre-diabetics-type-ii-diabetics-rural-research-article

Manuscript Received Review Round 1 Review Round 2 Review Round 3 Accepted
2014-09-25 2014-09-27 2014-10-04 2014-10-11 2014-10-18
Conflict of Interest Funding Ethical Approval Plagiarism X-checker Note
Nil Nil Yes 18%

© 2014by Sajja Srikanth, Y Lavanya, K Sushmaand Published by Siddharth Health Research and Social Welfare Society. This is an Open Access article licensed under a Creative Commons Attribution 4.0 International License https://creativecommons.org/licenses/by/4.0/ unported [CC BY 4.0].

Introduction

Uric acid is produced by the breakdown of purines and by direct synthesis from 5-phosphoribosyl pyrophosphate and glutamine. Serum urate levels vary with age and sex. Most children have serum urate concentrations of 180 to 240 μmol/l (3.0 to 4.0 mg/dl). Mean serum urate values of adult men and premenopausal women are 415 and 360 μmol/L (6.8 and 6.0 mg/dl) respectively. After menopause, values for women increase to approximate those of men. In adulthood, concentrations rise steadily over time and vary with height, body weight, blood pressure, renal function [1, 2] and alcohol intake.

Pre-diabetes is the condition in which the people have slight increase in blood glucose levels than the normal but they are not said to be diabetic. People with pre-diabetes may have impaired fasting glucose (IFG) or impaired glucose tolerance (IGT) or both IFG and IGT. IFG is a condition in which the fasting blood sugar level is elevated after an overnight fast but not high enough to be classified as diabetes (FBS between 110-125mg/dl). IGT s a condition in which the blood sugar level is elevated after a 2- hour oral glucose tolerance test, but is not high enough to be classified as diabetes (PPBS between 140- 199mg/dl).

In 2000 it was estimated that [3] 171 million people globally suffered from diabetes or 2.8% of the population suffered from diabetes. Type-2 diabetes is the most common type worldwide. As on 2007 [4] the 5 countries with the largest amount of people diagnosed with diabetes were India (40.9 million), China(38.9 million), US (19.2 million), Russia (9.6 million), and Germany (7.4 million).Currently, India is the diabetes capital of the world. The world prevalence of diabetes among adults (aged 20–79 years) was found to be 6.4%, affecting 285 million adults, in 2010, and it might be increase to 7.7%, and 439 million adults by 2030. Between 2010 and 2030 [5] there might be a 69% increase in numbers of adults with diabetes in developing countries and a 20% increase in developed countries. It was estimated that over 40 million of those with diabetes are currently in India and that by 2025 that number will grow to 70 million. Another 30 million Indians have pre-diabetes and are at high risk of developing type II diabetes mellitus (T2DM). Type II Diabetes is an economically costly disease and a major cause of mortality and morbidity.

In a study in different states of India, the weighted prevalence of diabetes (both known and newly diagnosed) was 10.4% in Tamilnadu, 8.4% in Maharashtra, 5.3% in Jharkhand, and 13.6% in Chandigarh and the prevalence of prediabetes (impaired fasting glucose and/or impaired glucose tolerance) was 8.3%, 12.8%,8.1% and 14.6% respectively.

Various mechanisms have been suggested through which uric acid may be implicated in the atherosclerotic process. Uric acid can act as a prooxidant, particularly at increased concentrations, and may be a marker of oxidative stress [6,7] but it may also have a therapeutic role as an antioxidant [8,9]. Plasma uric acid concentrations correlate with longevity in primates and other mammals [10], a characteristic that is presumably a function of urate’s antioxidant properties. Thus, it is unclear whether increased concentrations of uric acid in diseases associated with oxidative stress, such as atherosclerotic coronary heart disease (CHD), stroke and peripheral arterial occlusive disease, are a protective response or a primary cause. Some researchers have proposed that hyperuricemia-induced oxidative stress represents a cause of the metabolic syndrome [11]. Hyperuricemia has been found to be associated with obesity and insulin resistance, and consequently with type 2 diabetes .Other important biological effects of uric acid relate to endothelial dysfunction by inducing anti proliferative effects on endothelium and impairing nitric oxide production and inflammation, e.g., through increased C-reactive protein expression [12,13]. Uric acid may also play a role in immune activation with subsequent increased chemokine and cytokine expression [14].

Some studies considered Hyperuricemia to be a component of metabolic syndrome that reflects insulin resistance [15, 16]. In several epidemiological studies, a close relationship between hyperuricemia and hypertension, heart failure and other cardiovascular diseases has been reported [17, 18, 19, 20] and correlations between hyperuricemia and obesity, dyslipidemia, and diabetes have also been reported [21, 22].

There are numerous cross-sectional studies and prospective studies on serum uric acid concentration and the development of hypertension. Humans excrete 60- 70% of serum uric acid through kidneys, with the remainder


being excreted in feces. Over 90% of serum uric acid is soluble and not protein bound, and freely filtered by the kidneys. This makes filtered serum uric acid strongly dependent on glomerular filtration rate GFR). The proximal tubule serves as the site for further secretion and reabsorption of uric acid. Since most serum uric acid is freely filtered, reabsorption is the primary mechanism that influences baseline rates of uric acid in an individual. Reabsorption occurs by active transport coupled to Na-K-ATPase pump utilizing transport proteins, the most important of which are URAT1 and GLUT9.

Aims & Objectives

The main purpose of our study is to examine the association between serum uric acid, Body Mass Index & Blood Pressure in prediabetes and diabetes in rural population of Andhra Pradesh.

Materials & Methods

The study was conducted in 100 male subjects in the age range 30-50 years. The questionnaire with questions on demographic data, seafood consumption, drinking and smoking information, personal and family history of diabetes and gout, previous history of hypertension, cardiovascular disease was taken. Height and weight of the subjects was measured with participants wearing light clothes and without shoes. BMI was then calculated by dividing weight (kg) by height (m) squared. Three consecutive blood pressure readings using Omron digital BP apparatus, at least 30 seconds apart, were taken from the right arm of seated subjects, and the average of the three readings was used in the data analysis. All objectives and procedures to be followed for the study were explained in detail by the study investigator, the day before the data and blood samples were collected. Informed and written consent was obtained from all eligible individuals.

An overnight fast of 8–14 h, with no alcohol consumption on the previous night was ensured before proceeding with the tests. Fasting venous blood sample was collected for the estimation of FBS & Serum Uric acid. Both fasting plasma glucose (FPG) and 2-h plasma glucose postglucose load (2hPG) was measured  in all eligible subjects, all subjects were asked to take 75 g of anhydrous glucose in 200mL of water within

5 min (equivalent to 82.5 g of Glucon-D). Subjects were instructed not to indulge in any physical activity or to smoke during the study period. For the diagnosis of pre diabetes the 1999 WHO criteria (9) was used, impaired fasting glucose level with FBS between 110mg/dl - 125mg/dl, Impaired Glucose Tolerance with FBS between 140 – 199 mg/dl after 2 hours of glucose load . In this study the enzymatic glucose oxidase - peroxidase (GOD – POD; Erba Diagnostics) was used for estimation of blood glucose level. People with pre-diabetes may impaired fasting glucose (IFG) or impaired glucose tolerance (IGT). Some people may have both IFG and IGT. IFG is a condition in which the fasting blood sugar level is elevated after an overnight fast but is not high enough to be classified as diabetes (110- 125mg/dl). IGT is a condition in which the blood sugar level is elevated after a 2- hour oral glucose tolerance test, but is not high enough to be classified as diabetes (140- 199mg/dl). Serum Uric acid was measured using UricaseTrinder –Endpoint –Erba Diagnostics).

Exclusion Criteria: Patients with serum creatinine > 1.0 mg/dl; Family history of Hypertension, CV disease / Gout or any renal diseases; H/o Alcohol consumption/ smoking.

Inclusion Criteria: Male Subjects with prediabetes, diabetes and normal subjects (control) within the age of 30-50 years. Subjects were grouped into 3 groups as Group I – Prediabetes; Group II – DM Type II; Group III – control subjects (No DM/HTN). Statistical Analysis was done using t test assuming unequal variances and p value < 0.05 was considered significant.

Observation & Results

In Group I subjects (Subjects with Pre diabetes) (n = 16), the mean serum uric acid was 4.64± 0.97 mg/dl with a mean BMI of 25.88 ± 4.61 Kg/m2. The mean SBP & DBP in the same Group I subjects was 116.87 ± 17.02 mmHg & 79.38 ±13.89 mmHg respectively. The FBS and PPBS in Group I subjects were 116.63 ± 39.26 mg/dl & 198.31 ± 61.86 mg/dl respectively. In Group II subjects (Subjects with Diabetes) (n = 75), the mean serum uric acid was 3.436 ± 0.73 mg/dl with a mean BMI of 25.89 ± 4.07 Kg/m2. The mean SBP & DBP in the same Group II subjects was 128.98± 12.38 mmHg & 84.48 ± 8.85mmHg respectively. The FBS and PPBS in Group II subjects were 170.17


± 48.09 mg/dl & 284.06 ± 62.82 mg/dl respectively. In Group III subjects (Normal Control subjects) (n = 44), the mean serum uric acid was 4.15± 0.81 mg/dl with a mean BMI of 22.77 ± 3.90 Kg/m2. The mean SBP & DBP in the same Group III subjects was 119.09 ± 10.77mmHg & 75.59 ± 8.86 mmHg respectively. The FBS and PPBS in Group III subjects were 85.81 ± 10.085 mg/dl & 122 ± 8.3 mg/dl respectively.

Table 1: Comparison of Different parameters between Control and Pre diabetic subjects

  ControlGroup III Pre DiabetesGroup I P value   Inference
SBP mmHg ( Mean) 119.090 ±10.77 116.875 ± 17.02 0.3159 NS
DBP( Mean) mmHg 75.590 ± 8.86 79.375 ± 13.89 0.1606 NS
BMI ( Mean) Kg/m2 22.77 ± 3.90 25.882 ± 4.61 0.0250 S
FBS ( Mean) mg/dl 85.818 ± 10.08 116.625 ± 39.26 0.00342 HS
PPBS ( Mean) mg/dl 122 ± 8.3 198.312 ± 61.86 < 0.01 HS
SUA ( Mean) mg/dl 4.152±0.81 4.644±0.97 0.04176 S

Serum Uric acid when compared between Group III & Group I, we found an increase in SUA in pre diabetics i.e., Group I which is statistically significant (p = 0.0417). Also a highly significant increase in FBS & PPBS is observed in prediabetics when compared with the control subjects (p = 0.00342 & p < 0.01 respectively).BMI when compared between Group III & Group I subjects, we found a significant increase in BMI in pre diabetics i.e., Group I (p = 0.0250). We observed a non-significant decrease in SBP & a non-significant increase in DBP in Group III subjects when compared with Group I subjects (p = 0.3159 & p =0.1606 respectively).

Table 2: Comparison of Different parameters between Pre diabetic & diabetic subjects

  Pre diabetic Group I DiabeticGroup II P value Inference
SBP ( mean ) mmHg 116.87 ± 17.02 128.98 ± 12.38 0.00711 HS
DBP ( mean ) mmHg 79.375 ± 13.89 84.48 ± 8.85 0.0877 NS
BMI ( mean ) Kg/m2 25.88 ± 4.61 25.89 ± 4.07 0.4076 NS
FBS ( mean ) mg/dl 116.625 ± 39.26 170.173 ± 48.09 < 0.01 HS
PPBS ( mean ) mg/dl 198.312 ± 61.86 284.067 ± 62.62 < 0.01 HS
SUA ( mean ) mg/dl 4.643 ± 0.97 3.436 ± 0.73 < 0.01 HS

Serum Uric acid when compared between Group I & Group II, we found an decrease in SUA in pre diabetics i.e.,Group I which is statistically significant ( p < 0.01). Also a highly significant increase in FBS & PPBS is observed in prediabetics when compared with the diabetic subjects (Group II) (p < 0.01 &

p<0.01 respectively).BMI when compared between Group I & Group II subjects, we found a non-significant increase in BMI in pre diabetics i.e., Group I (p =0.4076). We observed a highly significant increase in SBP & a non-significant increase in DBP in Group II subjects when compared with Group subjects (p < 0.01 & p = 0.0877 respectively).

Table 3: Comparison of Different parameters between Controls

  ControlGroup III DiabeticGroup II P value Inference
SBP ( mean ) mmHg 119.09±10.7 128.98 ± 12.38 < 0.01 HS
DBP ( mean ) mmHg 75.591± 8.86 84.48 ± 8.85 < 0.01 HS
BMI ( mean ) Kg/m2 22.7 ± 3.90 25.89 ± 4.07 < 0.01 HS
FBS ( mean ) mg/dl 85.8 ± 10.08 170.173 ± 48.09 < 0.01 HS
PPBS ( mean ) mg/dl 122 ± 8.3 284.067 ± 62.82 < 0.01 HS
SUA ( mean )mg/dl 4.152 ± 0.81 3.436 ± 0.73 < 0.01 HS

Serum Uric acid when compared between Group III & Group II, we found a highly significant decrease in SUA in diabetics i.e.,Group II ( p< 0.01). Also a highly significant increase in FBS & PPBS is observed in diabetics when compared with the control subjects (p < 0.01 & p < 0.01 respectively).BMI when compared between Group III & Group II subjects , we found a highly significant increase in BMI in diabetics i.e., Group II (p < 0.01). We observed a highly significant increase in SBP and DBP in Group II subjects when compared with Group III subjects ( p < 0.01 & p < 0.01 respectively).

bm_9_01.JPG
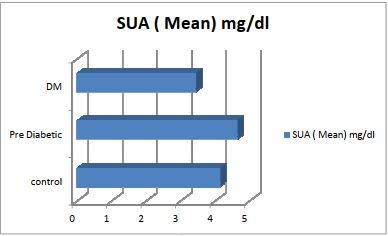
Fig 1: Graph showing Serum Uric Acid in different

Discussion

Modan et al [23] in their epidemiological study found that hyperinsulinemia was associated with an increase in serum uric acid concentration, and


this finding was significant after adjusting for BMI, degree of impaired glucose tolerance, and serum triglyceride concentration. Higher insulin levels are known to reduce renal excretion of urate. Insulin may enhance renal urate reabsorption via stimulation of the urate-anion exchanger URAT1 and/or the sodium-dependent anion cotransporter in brush border membranes of the renal proximal tubule [24] . Melvin R Hayden et al [11] concluded that in the atherosclerotic prooxidative environmental milieu, the original antioxidant properties of uric acid paradoxically becomes pro-oxidant, contributing to the oxidation of lipoproteins within atherosclerotic plaques, regardless of their origins in the MS, Type II Diabetes. In this milieu there exists an antioxidant – prooxidant urate redox shuttle. Non-diabetic atherosclerosis and atheroscleropathy were associated with the elevation of uric acid .Hyperuricemia has been associated with increasing body mass index (BMI) in recent studies and are even apparent in the adolescent youth [25]. The increase in BMI among different groups of our study correlates with this study. Bedir A et al [26] suggested that leptin might be one of the possible cause for the missing link between obesity and hyperuricemia.

Sudhindra rao M et al [27] observed that mean serum uric acid level was lower in control group (3.84 mg/dl), increased in pre-diabetics (4.88mg/dl) and again decreased in diabetics (3.78mg/dl). The results of our study were in accordance with this study regarding Serum Uric Acid. Ivonne Sluijs et al [28] concluded from their studies that high uric acid concentrations are associated with increased risk of diabetes which may be explained by the degree of adiposity. Several trials have shown reductions in the risk of developing diabetes among prediabetic individuals after lifestyle and drug-based interventions. Prediabetes may also convert back to normoglycaemia. Blood glucose in the prediabetic range is correlated with many risk factors, including general and central obesity, blood pressure, triglyceride and lipoprotein levels [29] .Studies using different measures of β-cell function have reported an abnormal decrease in insulin secretion in prediabetic people [30].

From the present hospital based cross sectional study, we observed a significant increase in the serum uric acid levels in prediabetics when compared with the control & diabetic subjects.

This is in accordance with the study done by Jasna Vucak et al [31] , BMI also showed a significant positive association with serum Uric acid in prediabetic subjects when compared with the control subjects which correlates with the other studies .We observed a highly significant decrease in Serum Uric Acid in diabetics when compared with pre diabetics.

Serum Uric Acid levels tend to increase in pre diabetics and decrease in diabetics which correlates with the other studies. Even though we observed an increase in BMI in diabetics when compared with control subjects, Serum Uric Acid was found to be significantly decreased in diabetic subjects. The Pre CIS study [32] has shown that uric acid levels are increased in patients with hypertension and diabetes and the results of our study do not support this study.

Possible mechanisms behind the interaction between glucose load and uric acid levels in patients with insulin resistance may involve a reduction in the synthesis of uric acid, altered excretion of uric acid, or an increase in consumption of uric acid as an antioxidant.

The relationship between serum uric acid and fasting glucose levels is a picture of counteracting forces, with a bellshaped relationship.

Conclusion

From the observations of our study it can concluded that the serum uric acid level was higher in pre-diabetes than controls and lower in diabetes mellitus than pre-diabetes and control subjects .The uric acid may serve as a marker for deterioration of glucose metabolism. Pre-diabetics were at higher risk of developing uric acid related complications like gout etc.

Limitations: This study was a cross-sectional study and the sample size in prediabetics is very small (n=16). A large sample size and a longitudinal study may help to elucidate the impact of Uric acid and BMI on Type II diabetes. Our study did not consider the duration of diabetes which may have a definite role on serum uric acid levels. Further analysis using measures of Insulin resistance might determine the exact cause of change in uric acid levels in pre diabetes and diabetes. Further studies are needed to assess the longitudinal relationship between BMI and uric acid in relation to cause and effect.


Summary: Serum Uric Acid levels tend to increase in pre diabetics and decrease in diabetics. Even though we observed an increase in BMI in diabetics when compared with control subjects, Uric Acid was found to be significantly decreased in diabetic subjects.

Acknowledgements: We are thankful to all the subjects who participated in the study. We express our sincere gratitude to the funding by ICMR (STS project).

References

  1. Robert I Wortmann et al. Disorders of purine and pyramidine metabolism, In Harrison`s principle of internal medicine, 18th ed. Dan L Lango,Anthony S Fauci , Dennis L Kasper et al (Eds). New York, Mc Graw Hill, 2012.
  2. Victor W Rodwell et al. Metabolism nucleotides, In Harper`s illustrated biochemistry, 28th ed . Robert murray et al (eds.). New York, Mc Graw Hill, Lange publishers, 2009.
  3. Sarahwild , Roglic G, Green A , Sicree R, King H . Global Prevalence of Diabetes Estimates for the year 2000 and projections for 2030. Diabetes Care 2004 May; 27(5): 1047–1053.
  4. International Diabetes Federation. Diabetes facts. Diabetes Atlas. 4th edition. 2009.
  5. Shaw JE, Sicree RA, Zimmet PZ. Global estimates of the prevalence of diabetes for 2010 and 2030. Diabetes Res Clin Pract. 2010 Jan; 87(1):4-14. doi: 10.1016/j.diabres.2009.10.007. Epub 2009 Nov 6
  6. Becker BF. Towards the physiological function of uric acid. Free Radic Biol Med. 1993 Jun; 14(6):615-31.
  7. Strazzullo P, Puig JG. Uric acid and oxidative stress: relative impact on cardiovascular risk? Nutr Metab Cardiovasc Dis. 2007 Jul; 17(6):409-14.
  8. Becker BF, Reinholz N, Leipert B, Raschke P, Permanetter B, Gerlach E. Role of uric acid as an endogenous radical scavenger and antioxidant. Chest 1991; 100 (3 suppl):176S -181S.
  9. Strasak AM, Rapp K, Hilbe W, Oberaigner W, Ruttmann E, Concin H et al. The
  1. role of serum uric acid as an antioxidant protecting against cancer: prospective study in more than 28000 older Austrian women. Ann Oncol 2007; (18):1893 - 7.
  2. Cutler RG. Urate and ascorbate: their possible roles as antioxidants in determining longevity of mammalian species. Arch Gerontol Geriatr. 1984 Dec; 3(4):321-48.
  3. Hayden MR, Tyagi SC. Uric acid: a new look at an old risk marker for cardiovascular disease, metabolic syndrome, and type 2 diabetes mellitus: the urate redox shuttle. Nutr Metab (Lond). 2004 Oct 19; 1(1):10.
  4. Kanellis J, Kang DH. Uric acid as a mediator of endothelial dysfunction, inflammation, and vascular disease. Semin Nephrol. 2005 Jan; 25(1):39-42.
  5. Waring WS, McKnight JA, Webb DJ, Maxwell SR. Uric acid restores endothelial function in patients with type 1 diabetes and regular smokers. Diabetes. 2006 Nov; 55(11):3127-32.
  6. Gersch MS, Johnson RJ. Uric acid and the immune response. Nephrol. Dial. Transplant. (2006) 21 (11): 3046-3047. doi: 10.1093/ndt/gfl226.
  7. Sung KC, Kim BJ, Kim BS, Kang JH, Lee MH, Park JR, et al. In normoglycemic Koreans, insulin resistance and adipocity are independently correlated with high blood pressure. Circ J. 2004 Oct; 68(10):898-902.
  8. Saggiani F, Pilati S, Targher G, Branzi P, Muggeo M, Bonora E. Serum uric acid and related factors in 500 hospitalized subjects. Metabolism. 1996 Dec; 45(12):1557-61.
  9. Klein R, Klein BE, Cornoni JC, Maready J, Cassel JC, Tyroler HA. Serum uric acid: Its relationship to coronary heart disease risk factors and cardiovascular disease in Evans County, Georgia. Arch Intern Med. 1973 Sep; 132(3):401-10.
  10. Kahn HA, Medalie JH, Neufeld HN, Riss E, Goldbourt U. The incidence of hypertension and associated factors: The Israel ischemic heart disease study. Am Heart J 1972; 84 (2): 171- 182.
  11. Selby JV, Friedman GD, Queensberry CP. Precursors of essential hypertension:

  1. Pulmonary function, heart rate, uric acid, serum cholesterol and other serum chemistries. Am J Epidemiol. 1990 Jun; 131(6):1017-27.
  2. Jossa F, Farinaro E, Panico S, Krogh V, Celentano E, Galasso R, et al. Serum uric acid and hypertension: The Olivetti heart study. J Hum Hypertens. 1994 Sep; 8 (9):677-81
  3. Zavaroni I, Mazza S, Fantuzzi M, Dall’Aglio E, Bonora E, Delsignore R, et al. Changes in insulin and lipid metabolism in males with asymptomatic hyperuricaemia. J Intern Med. 1993 Jul; 234(1):25-30
  4. Vuorinen Markkola H, Yki Jarvinen H. Hyperuricemia and insulin resistance. J Clin Endocrinol Metab. 1994 Jan; 78(1):25-9.
  5. Modan M, Halkin H, Karasik A, Lusky A. Elevated serum uric acid: A facet of hyperinsulinaemia. Diabetologia 1987 September; 30(9): 713 – 718.
  6. Choi HK, Ford ES. Haemoglobin A1C, fasting glucose, serum C-peptide and insulin resistance in relation to serum uric acid levels—the Third National Health and Nutrition Examination Survey. Rheumatology (Oxford). 2008 May; 47(5):713-7. doi: 10.1093/rheumatology/ken066. Epub 2008 Apr 5.
  7. Conen D, Wietlisbach V, Bovet P, Shamlaye C, Riesen W, Paccaud F, Burnier M: Prevalence of hyperuricemia and relation of serum uric acid with cardiovascular risk factors in a developing country. BMC Public Health. 2004; 4: 9. doi: 10.1186/1471-2458-4-9
  8. Bedir A, Topbas M, Tanyeri F, Alvur M, Arik N: Leptin might be a regulator of serum uric acid concentrations in humans. Jpn Heart J. 2003 Jul; 44(4):527-36.
  9. Sudhindra Rao M, Bino John Sahayo. A study of serum uric acid in diabetes mellitus and pre diabetes in a south Indian tertiary care hospital. NUJHS 2012June; 2(2): 18 - 23.
  10. Sluijs I, Joline Beulens JW , Vander A DL, Spijkerman AM , SchulzeMB ,van der Schouw YT . Plasma Uric Acid Is Associated with Increased Risk of Type 2 Diabetes Independent of Diet and Metabolic Risk Factors. J Nutr. 2013 Jan; 143(1):80-5. doi: 10.3945/jn.112.167221. Epub 2012 Nov 21.
  1. Sarwar N, Gao P, Seshasai SR, Gobin R, Kaptoge S, Di Angelantonio E et al. Diabetes mellitus, fasting blood glucose concentration, and risk of vascular disease: a collaborative meta-analysis of 102 prospective studies. Lancet. 2010 Jun 26; 375(9733):2215-22. doi: 10.1016/S0140-6736(10)60484-9.
  2. Abdul-Ghani MA, Tripathy D, DeFronzo RA. Contributions of beta-cell dysfunction and insulin resistance to the pathogenesis of impaired glucose tolerance and impaired fasting glucose. Diabetes Care. 2006 May; 29(5):1130-9.
  3. Vucak J , Katić M, Bielen I, Vrdoljak D , Lalić DI , Kranjčević K, Marković BB . Association between hyperuricemia, prediabetes, and prehypertension in the Croatian adult population - a cross-sectional study. BMC Cardiovasc Disord. 2012 Dec 4; 12:117. doi: 10.1186/1471-2261-12-117.
  4. Loachimescu AG, Brennan DM, Hoar BM, Hazen SL, Hoogwerf BJ: Serum uric acid is an independent predictor of all-cause mortality in patients at high risk of cardiovascular disease. Arthritis Rheum. 2008 Feb; 58(2):623-30. doi: 10.1002/art.23121